Data Interpretation Questions from Assam Exams: 13 Previous Year MCQs with Answers
Every data interpretation question from 4 real Assam recruitment papers, in one place. Use it to see which facts come up again and again.
Where these questions were asked
| Exam | Questions |
|---|---|
| APSC CCE Prelims | 12 |
| Assam TET | 1 |
Most-asked subtopics
| Subtopic | Questions |
|---|---|
| Tables | 4 |
| Data tables | 3 |
| Bar charts | 2 |
| Pie charts | 2 |
| Line graphs | 1 |
| Population diagrams | 1 |
All 13 questions
-
Instruction : Read the table below and answer the Question Nos. 74 and 75 :
: M :
Yearly commission earned by five salesmen (in Z)
050 1 090
2020 2021 2022 2023 2024 2025
Salesman A
OA 27,350 28,500 25,200 29,800 24,600 27,000
Salesman B
B 26,850 27,900 27,400 28,000 25,500 29,000
Salesman C
26,200 27,900 28,200 29,100 29,400 30,000
Salesman D
D 27,850 30,040 29,800 30,060 29,800 32,000
Salesman E
E 28,640 29,000 28,750 30,000 29,750 29,700In the year 2024, the commission earned by salesman D was approximately what
percent more of the commission earned by salesman A?
17. 21 (21·14
24. 34 27. 05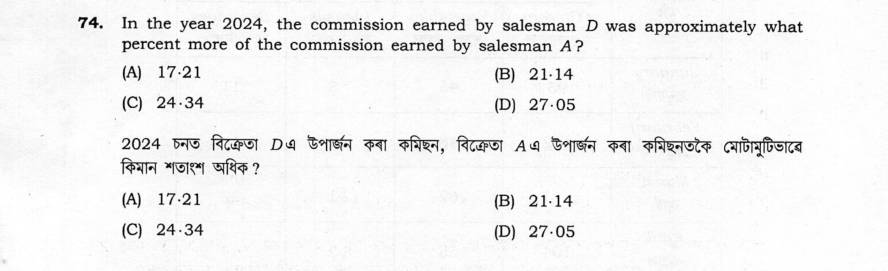
Show answer
Answer: (B)
Official provisional answer key
-
Instruction : Read the table below and answer the Question Nos. 74 and 75 :
: M :
Yearly commission earned by five salesmen (in Z)
050 1 090
2020 2021 2022 2023 2024 2025
Salesman A
OA 27,350 28,500 25,200 29,800 24,600 27,000
Salesman B
B 26,850 27,900 27,400 28,000 25,500 29,000
Salesman C
26,200 27,900 28,200 29,100 29,400 30,000
Salesman D
D 27,850 30,040 29,800 30,060 29,800 32,000
Salesman E
E 28,640 29,000 28,750 30,000 29,750 29,700In the year 2023, the commission of the salesman Bwas approximately what percent of
the total commission earned by the five salesmen that year?
12 19
28 34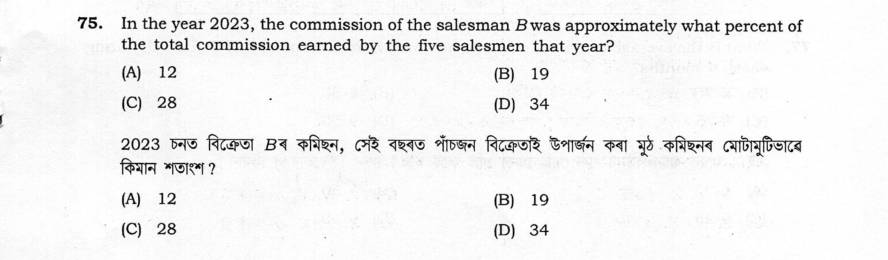
Show answer
Answer: (B)
Official provisional answer key
-
Instruction : The following table provides the amount of income of a departmental store
for 4 months (in thousand). Read the table carefully and answer the Question Nos. 77
and 78 :
M M (0 (?) M q (?) : MWhat is the average income of the store per month from utensils (in thousand) during
these 4 months?
6. 75 B8.50
)9.25 9. 50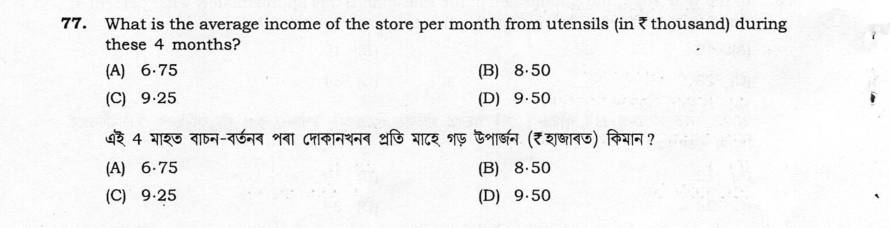
Show answer
Answer: (B)
Official provisional answer key
-
The table below shows the daily income of 50 persons in rupees :
Income (in (?) Number of persons
Less than 200 12
Less than 250 26
Less than 300 34
Less than350 40
Less than 400 50
(A) 6
(?) 40
(C) 16
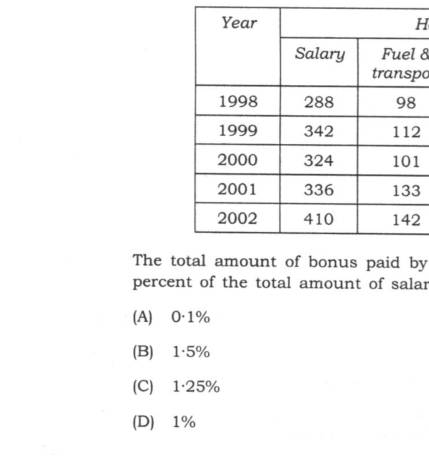
Year
Salary Fuel &
transport
1998 288 98
1999 342 112
2000 324 101
2001 336 133
2002 410 142
percent of the total amount of salary paid during the same period?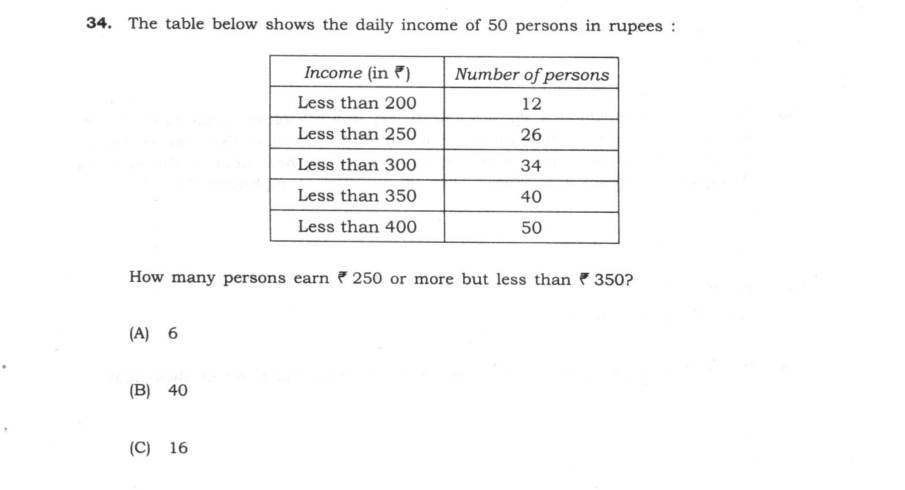
- A 0·1%
- B 1·5%
- C 1·25%
- D 1%
Show answer
Answer: (D) 1%
Official provisional answer key
-
Study the given pie charts and answer the question :
Sources of Funds for the School
Government
12%
NGOs
38% Internal Sources
15%
Donations
35%
Use of Funds by the School
Payment
11%↑
Reserved
71 33%
Scholarship
26%
School Maintenance
30%
If the scholarship has to be paid out of the donations fund, then what is the
percentage of donations fund used for this purpose? The entire funds that the school
getsfrom different sources is 10 lakhs.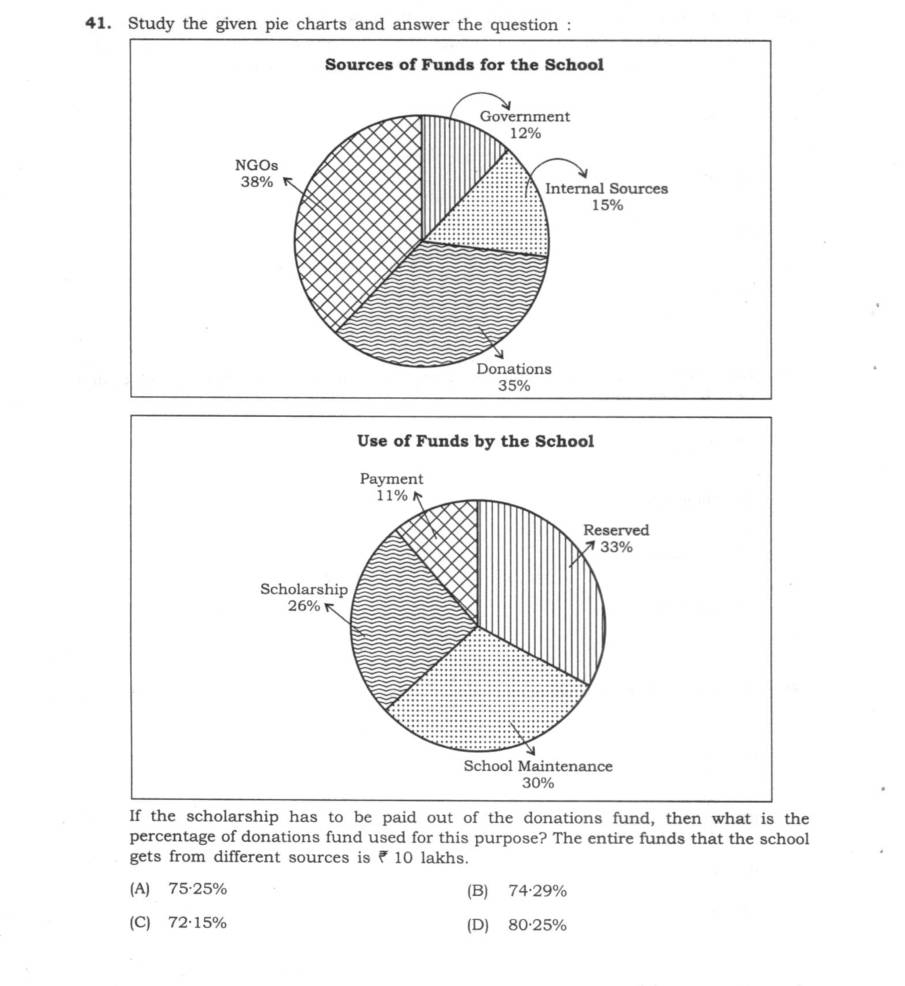
- A 75·25%
- B 74·29%
- C 72·15%
- D 80·25%
Show answer
Answer: (B) 74·29%
Official provisional answer key
-
In the figures below, the outer box represents the population of Assam as per 2011
respective sexes. Which one of the following is closest to the actual data?
Illiterate Illiterate
Literate Literate
Male Female
Illiterate
Illiterate
Literate Literate
Male Female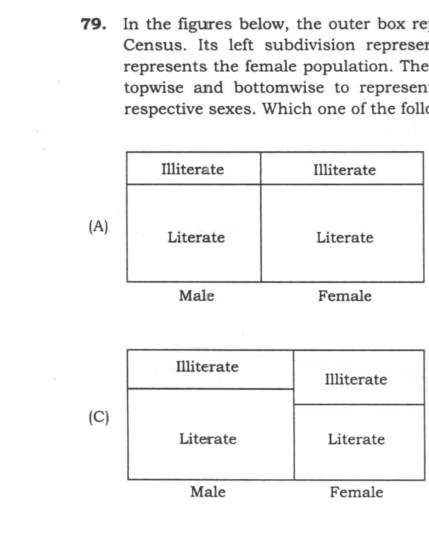
Show answer
Answer: (C)
Official provisional answer key
-
The average monthly expenditure of a small manufacturing unit is shown in the
following table :
Sl. No. Expenditure head Expenditure
(in rupees lakh)
1 Raw materials 12. 0
2 Salary 4. 5
3 Packaging 0·75
4 Transport 0·5
5 Miscellaneous overhead expenditure 3. 5
In order to maximize the profit margin, you would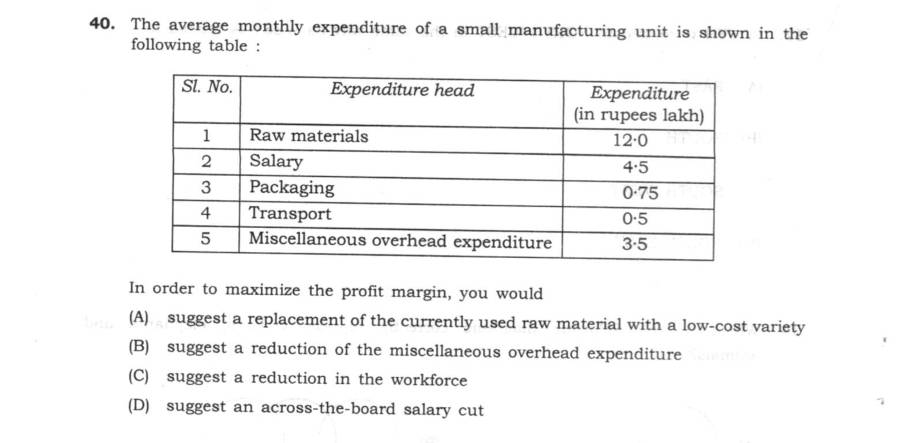
- A suggest a replacement of the currently used raw material with a low-cost variety
- B suggest a reduction of the miscellaneous overhead expenditure
- C ()suggest a reduction in the workforce
- D suggest an across-the-board salary cut
Show answer
Answer: (B) suggest a reduction of the miscellaneous overhead expenditure
Official provisional answer key
-
Given below is the analysis of the result of an examination :
1. Total candidates 100
2. Passed in all the five subjects : 50
3. Failed only in English 10
4. Failed only in Mathematics 8
5. Failed only in Physics 2
6. Failed only in Chemistry 5
7. Failed only in Biology 10
How many candidates passed in at least four subjects?
85 35
70 65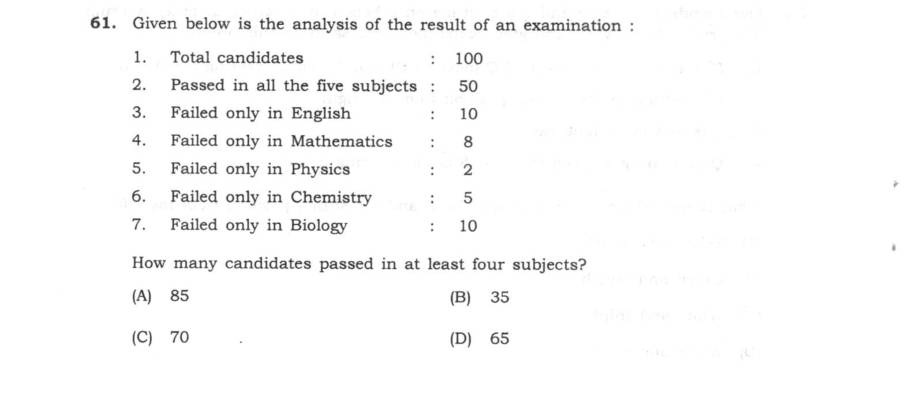
Show answer
Answer: (A)
Official provisional answer key
-
The line graph below shows the yearly production output of a tractor manufacturing
company :
Production Figures
E
1100
1000
No. of units produced 800
2014 2015 2016 2017 2018 2019 2020 2021
Year
In which year, the company suffered the lowest rate of increase in production?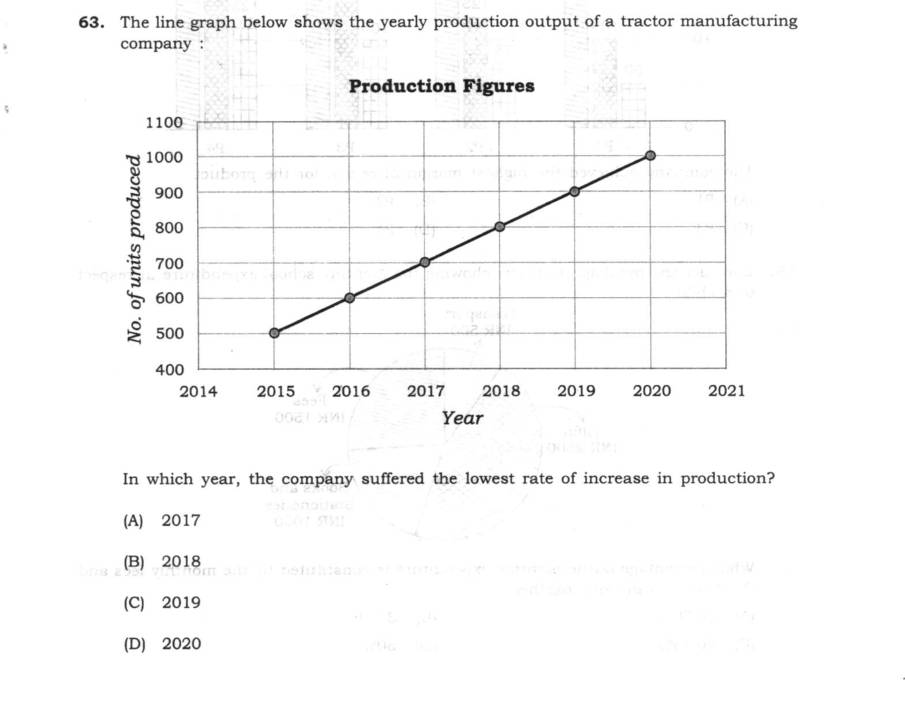
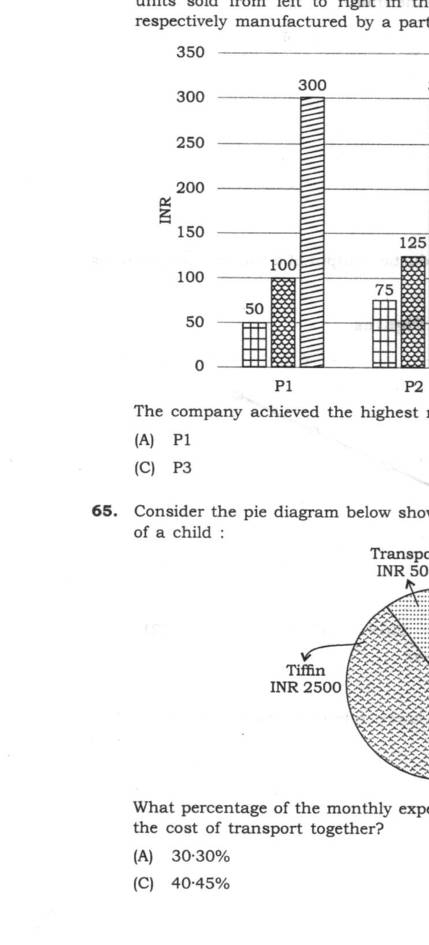
- A 2017 P1
- B 2018 P3 of a child : Transport INR 500 Tiffin INR 2500 the cost of transport together?
- C 2019 30·30% 40·45%
- D 2020 respectively manufactured by a particular company : 300 300 INR P1 P2 The company achieved the highest margin of return for the product
Show answer
Answer: (D) 2020 respectively manufactured by a particular company : 300 300 INR P1 P2 The company achieved the highest margin of return for the product
Official provisional answer key
-
The histogram below shows the cost price in INR, sell price in INR and number of
units sold from left to right in the last FY for 4 products Pl, P2, P3 and P4
300 300
P3 P4
P2
P4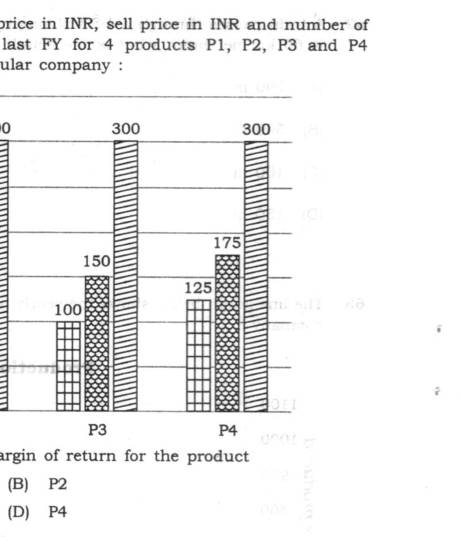
Show answer
Answer: (A)
Official provisional answer key
-
Consider the pie diagram below showing the monthly school expenditure in respect
Fees
INR 1500
Books and
Stationeries
INR 1000
36·36%
D50%
24 IS)AI8V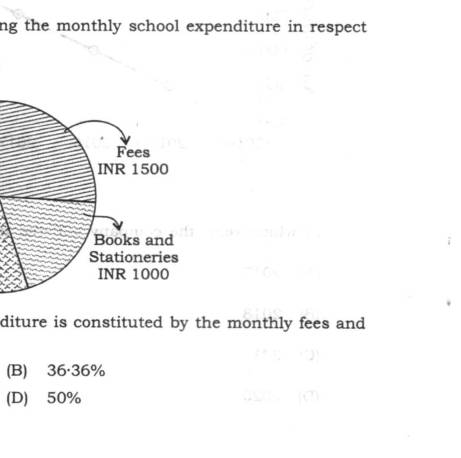
Show answer
Answer: (B)
Official provisional answer key
-
A car travels 100 km from a location P to a location Q. The table below records the
average speed of the car in different segments of the journey :
Distance travelled Average speed (in kmph)
First 20 km 40
Next 30 km 60
Next 10 km 40
Next 40 km 60
What is the average speed of the car for the entire journey from P to Q?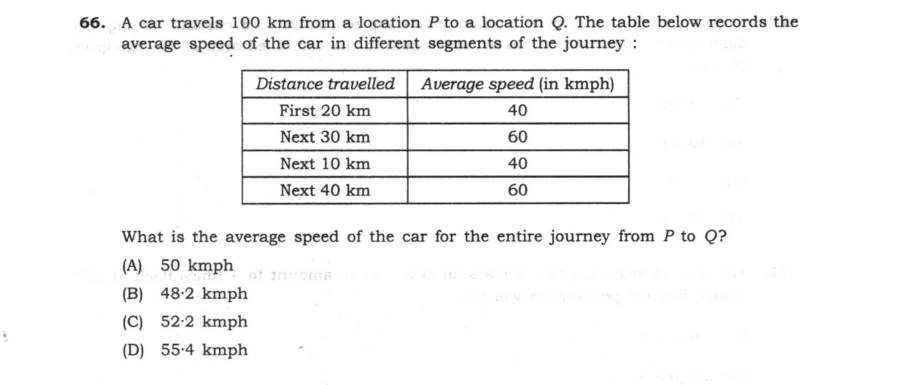
- A 50 kmph
- B (48·2 kmph
- C 52. 2 kmph
- D (55.4 kmph
Show answer
Answer: (A) 50 kmph
Official provisional answer key
-
In an examination, the performance of the students is represented by the bar diagram given above. What is
the percentage of students, who have obtained less then 80% marks ?
- A 60%
- B 70%
- C 80%
- D 90%
Show answer
Answer: (C) 80%
The chart on the preceding page gives (24+40)/(24+40+16)=80% below 80% marks.
Worked solution by AxomRank (no official key was published)
Sources and corrections
From the open AxomRank PYQ dataset. Each question links back to its paper. See how to report a correction.